グラフィック用数学ライブラリ&フィルタ More...
Go to the source code of this file.
Functions | |
| WSGraph | Laplacian (WSGraph vp, int mode) |
| WSGraph | xSobel (WSGraph vp) |
| FSGraph | fxSobel (FSGraph vp) |
| WSGraph | ySobel (WSGraph vp) |
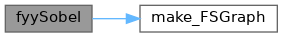
| FSGraph | fySobel (FSGraph vp) |
| WSGraph | zSobel (WSGraph vp) |
| FSGraph | fzSobel (FSGraph vp) |
| WSGraph | xxSobel (WSGraph vp) |
| FSGraph | fxxSobel (FSGraph vp) |
| WSGraph | yySobel (WSGraph vp) |
| FSGraph | fyySobel (FSGraph vp) |
| WSGraph | zzSobel (WSGraph vp) |
| FSGraph | fzzSobel (FSGraph vp) |
| VSGraph | vNabra (WSGraph vp) |
| VSGraph | vfNabra (FSGraph vp) |
| WSGraph | Nabra (WSGraph vp) |
| FSGraph | fNabra (FSGraph vp) |
| VSGraph | curvature3D (FSGraph vp) |
| VSGraph | curvature (FSGraph vp) |
| WSGraph | curv2WSGraph (VSGraph xp) |
| WSGraph | WSCurve (WSGraph gx, int mode, int cc) |
| WSGraph | edge_enhance (WSGraph gd, int mode) |
| FMask | gauss_mask (double sig, int ms, int md) |
| WSGraph | imask (WSGraph xp, FMask mask) |
| WSGraph | median (WSGraph xp, int ms) |
| WSGraph | to2d (WSGraph gd, int mode) |
| WSGraph | euclid_distance (WSGraph vp, int *rr, int bc) |
| int | out_round (WSGraph vp, int x, int y, IRBound *rb, int mode) |
Detailed Description
- Version
- 3.0
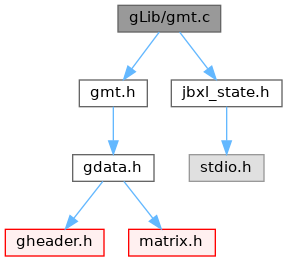
Definition in file gmt.c.
Function Documentation
◆ curv2WSGraph()
WSGraph curv2WSGraph(VSGraph xp)
3次元曲率データから曲面の形状を判定する.
- Parameters
-
xp 操作対象となる3次元曲率の入ったグラフィックデータ.
- Returns
- 曲面の形状情報を代入した sWord型グラフィックデータ.
- Note
- 曲面の形状の種類は
PEAK, PIT, SADDLE_RIDGE, SADDLE_VALLEY, NONE_SHAPE, MINIMAL, RIDGE, VALLEY, FLAT
Definition at line 1411 of file gmt.c.
References FLAT, WSGraph::gp, VSGraph::gp, JBXL_GRAPH_NODATA_ERROR, make_WSGraph(), MINIMAL, NONE_SHAPE, PEAK, PIT, RIDGE, SADDLE_RIDGE, SADDLE_VALLEY, WSGraph::state, VALLEY, vector::x, WSGraph::xs, VSGraph::xs, vector::y, WSGraph::ys, VSGraph::ys, WSGraph::zs, and VSGraph::zs.
Referenced by WSCurve().


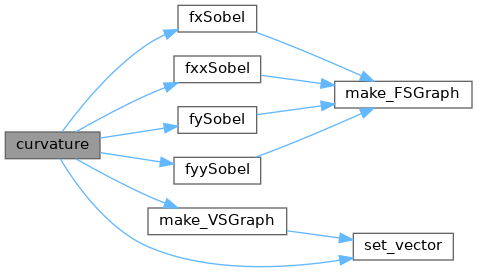
◆ curvature()
2Dグラフィックデータの3次元曲率を実数計算する.
- Parameters
-
vp 計算対象となるグラフィックデータ構造体.
- Returns
- 3次元曲率を代入した vector型グラフィックデータ(K,Hの2次元).
Definition at line 1336 of file gmt.c.
References free_VSGraph, freeNull, fxSobel(), fxxSobel(), fySobel(), fyySobel(), FSGraph::gp, VSGraph::gp, JBXL_GRAPH_ERROR, JBXL_GRAPH_IVDARG_ERROR, JBXL_GRAPH_NODATA_ERROR, make_VSGraph(), set_vector(), VSGraph::state, FSGraph::xs, FSGraph::ys, and FSGraph::zs.
Referenced by WSCurve().

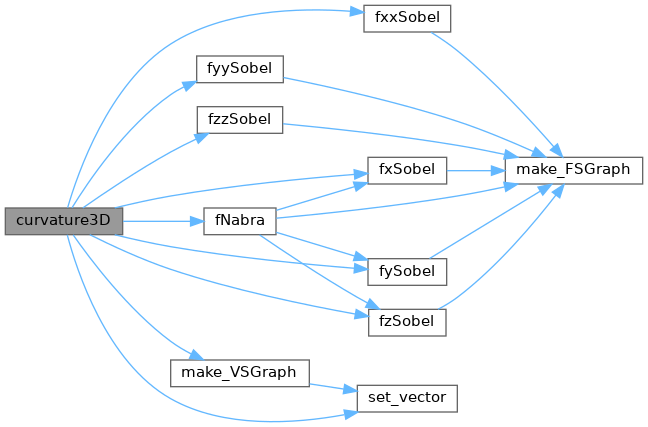
◆ curvature3D()
VSGraph curvature3D(FSGraph vp)
3Dグラフィックデータの4次元曲率を実数計算する.
- Parameters
-
vp 計算対象となるグラフィックデータ構造体.
- Returns
- 4次元曲率を代入した vector型グラフィックデータ(K,Hの2次元).
Definition at line 1235 of file gmt.c.
References fNabra(), free_VSGraph, freeNull, fxSobel(), fxxSobel(), fySobel(), fyySobel(), fzSobel(), fzzSobel(), FSGraph::gp, VSGraph::gp, JBXL_GRAPH_ERROR, JBXL_GRAPH_IVDARG_ERROR, JBXL_GRAPH_NODATA_ERROR, make_VSGraph(), set_vector(), VSGraph::state, FSGraph::xs, FSGraph::ys, and FSGraph::zs.
Referenced by WSCurve().

◆ edge_enhance()
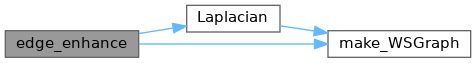
WSGraph edge_enhance(WSGraph gd, int mode)
2Dグラフィックデータのラプラシアンを使ったエッジ強調.
- Parameters
-
gd 計算対象となるグラフィックデータ構造体. mode モード.
4: 4近傍ラプラシアン.
8: 8近傍ラプラシアン 3x3
その他: Sobelのラプラシアン(24近傍) 5x5
- Returns
- 処理されたグラフィックデータ.
Definition at line 1521 of file gmt.c.
References WSGraph::gp, JBXL_GRAPH_NODATA_ERROR, Laplacian(), make_WSGraph(), WSGraph::state, WSGraph::xs, and WSGraph::ys.
◆ euclid_distance()
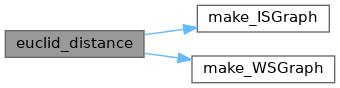
WSGraph euclid_distance(WSGraph vp, int* rr, int bc)
WSGグラフィック上を2値化し,各点における輝度値0の点からのユークリッド距離の最小を求める.
- Parameters
-
vp 操作対象となるグラフィックデータ構造体. *rr 指定しない.画像中のユークリッド距離の最大値が入る. bc 輝度値の2値化の値.これより小さいものは0,これ以上は1.
- Returns
- 輝度値の代わりにユークリッド距離が記入されたグラフィックデータ.
Definition at line 1888 of file gmt.c.
References free_WSGraph, WSGraph::gp, ISGraph::gp, JBXL_GRAPH_NODATA_ERROR, Lxt, make_ISGraph(), make_WSGraph(), Max, Min, WSGraph::state, ISGraph::state, Vxt, WSGraph::xs, WSGraph::ys, and WSGraph::zs.
◆ fNabra()
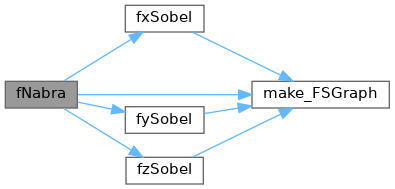
WSGraph fNabra(WSGraph vp)
グラフィックデータの ナブラの絶対値を実数計算する(Sobel). 精度が上昇するが時間がかかる.
- Parameters
-
vp 計算対象となるグラフィックデータ構造体.
- Returns
- ナブラ.double型グラフィックデータ.
Definition at line 1162 of file gmt.c.
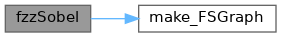
References free_FSGraph, fxSobel(), fySobel(), fzSobel(), FSGraph::gp, JBXL_GRAPH_NODATA_ERROR, make_FSGraph(), FSGraph::state, FSGraph::xs, FSGraph::ys, and FSGraph::zs.
Referenced by curvature3D().

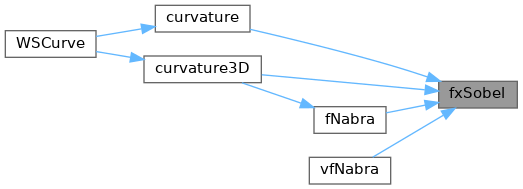
◆ fxSobel()
グラフィックデータの x方向微分(Sobel)を実数計算する. 精度が上昇するが時間がかかる.
- Parameters
-
vp 計算対象となる double型グラフィックデータ構造体.
- Returns
- 処理されたグラフィックデータ.
Definition at line 140 of file gmt.c.
References FSGraph::gp, JBXL_GRAPH_NODATA_ERROR, make_FSGraph(), FSGraph::state, Vx, FSGraph::xs, FSGraph::ys, and FSGraph::zs.
Referenced by curvature(), curvature3D(), fNabra(), and vfNabra().

◆ fxxSobel()
グラフィックデータの x方向の2階微分(Sobel)を実数計算する. 精度が上昇するが時間がかかる.
- Parameters
-
vp 計算対象となる double型グラフィックデータ構造体.
- Returns
- 処理されたグラフィックデータ.
Definition at line 492 of file gmt.c.
References FSGraph::gp, JBXL_GRAPH_NODATA_ERROR, make_FSGraph(), FSGraph::state, FSGraph::xs, FSGraph::ys, and FSGraph::zs.
Referenced by curvature(), and curvature3D().


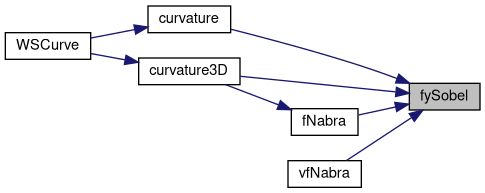
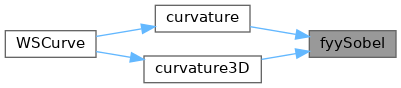
◆ fySobel()
グラフィックデータの y方向微分(Sobel)を実数計算する. 精度が上昇するが時間がかかる.
- Parameters
-
vp 計算対象となる double型グラフィックデータ構造体.
- Returns
- 処理されたグラフィックデータ.
Definition at line 237 of file gmt.c.
References FSGraph::gp, JBXL_GRAPH_NODATA_ERROR, make_FSGraph(), FSGraph::state, Vx, FSGraph::xs, FSGraph::ys, and FSGraph::zs.
Referenced by curvature(), curvature3D(), fNabra(), and vfNabra().

◆ fyySobel()
グラフィックデータの y方向の2階微分(Sobel)を実数計算する. 精度が上昇するが時間がかかる.
- Parameters
-
vp 計算対象となる double型グラフィックデータ構造体.
- Returns
- 処理されたグラフィックデータ.
Definition at line 646 of file gmt.c.
References FSGraph::gp, JBXL_GRAPH_NODATA_ERROR, make_FSGraph(), FSGraph::state, FSGraph::xs, FSGraph::ys, and FSGraph::zs.
Referenced by curvature(), and curvature3D().
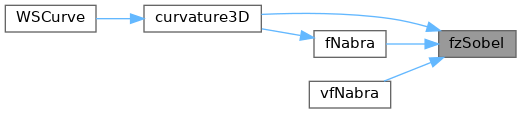
◆ fzSobel()
グラフィックデータの z方向微分(Sobel)を実数計算する. 精度が上昇するが時間がかかる.
- Parameters
-
vp 計算対象となる double型グラフィックデータ構造体.
- Returns
- 処理されたグラフィックデータ.
Definition at line 350 of file gmt.c.
References FSGraph::gp, JBXL_GRAPH_IVDARG_ERROR, JBXL_GRAPH_NODATA_ERROR, make_FSGraph(), FSGraph::state, Vx, FSGraph::xs, FSGraph::ys, and FSGraph::zs.
Referenced by curvature3D(), fNabra(), and vfNabra().

◆ fzzSobel()
グラフィックデータの z方向の2階微分(Sobel)を実数計算する. 精度が上昇するが時間がかかる.
- Parameters
-
vp 計算対象となる double型グラフィックデータ構造体.
- Returns
- 処理されたグラフィックデータ.
Definition at line 829 of file gmt.c.
References FSGraph::gp, JBXL_GRAPH_IVDARG_ERROR, JBXL_GRAPH_NODATA_ERROR, make_FSGraph(), FSGraph::state, FSGraph::xs, FSGraph::ys, and FSGraph::zs.
Referenced by curvature3D().

◆ gauss_mask()
| FMask gauss_mask | ( | double | sig, |
| int | ms, | ||
| int | md | ||
| ) |
FMask gauss_mask(double sig, int ms, int md)
ガウシアン処理用のフィルタをつくり出す.
- Parameters
-
sig ガウス関数のσ. ms フィルタの大きさ.
md モード.2: 2次元.その他: 3次元
- Returns
- ガウシアン用フィルタ
Definition at line 1558 of file gmt.c.
References FMask::imask, Min, FMask::mode, FMask::msize, FMask::nfact, and SINTMAX.
◆ imask()
WSGraph imask(WSGraph xp, FMask mask)
フィルタ処理を行なう.
- Parameters
-
xp 対象となるグラフィックデータ構造体. mask 処理用マスク.
- Returns
- マスク処理されたグラフィックデータ.
Definition at line 1627 of file gmt.c.
References WSGraph::gp, FMask::imask, JBXL_GRAPH_IVDARG_ERROR, JBXL_GRAPH_NODATA_ERROR, make_WSGraph(), Min, FMask::mode, FMask::msize, FMask::nfact, SINTMAX, WSGraph::state, WSGraph::xs, WSGraph::ys, and WSGraph::zs.

◆ Laplacian()
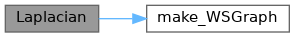
WSGraph Laplacian(WSGraph vp, int mode)
2Dグラフィックデータのラプラシアンを計算する.
- Parameters
-
vp 計算対象となるグラフィックデータ構造体. mode モード. 4: 4近傍ラプラシアン mode 8: 8近傍ラプラシアン mode その他: Sobelのラプラシアン(24近傍)
- Returns
- 処理されたグラフィックデータ.
Definition at line 24 of file gmt.c.
References WSGraph::gp, JBXL_GRAPH_NODATA_ERROR, make_WSGraph(), Px, WSGraph::state, WSGraph::xs, and WSGraph::ys.
Referenced by edge_enhance().

◆ median()
WSGraph median(WSGraph xp, int ms)
メディアンフィルタ処理を行なう.3D処理可.
- Parameters
-
xp 対象となるグラフィックデータ構造体. ms フィルタの大きさ.
- Returns
- メディアンフィルタ処理されたグラフィックデータ.
Definition at line 1701 of file gmt.c.
References WSGraph::gp, JBXL_GRAPH_MEMORY_ERROR, JBXL_GRAPH_NODATA_ERROR, make_WSGraph(), Min, WSGraph::state, WSGraph::xs, WSGraph::ys, and WSGraph::zs.

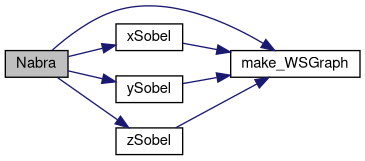
◆ Nabra()
グラフィックデータの ナブラの絶対値を計算する(Sobel).
- Parameters
-
vp 計算対象となるグラフィックデータ構造体.
- Returns
- ナブラ.sWord型グラフィックデータ.
Definition at line 1088 of file gmt.c.
References free_WSGraph, WSGraph::gp, JBXL_GRAPH_NODATA_ERROR, make_WSGraph(), WSGraph::state, WSGraph::xs, xSobel(), WSGraph::ys, ySobel(), WSGraph::zs, and zSobel().
◆ out_round()
int out_round(WSGraph vp, int x, int y, IRBound* rb, int mode)
2Dグラフィックデータ構造体vpの(x,y)にあるオブジェクトの周囲長を得る.
- Parameters
-
vp 操作対象となる 2D グラフィックデータ構造体. x,y 情報を得たいオブジェクトの左上縁の座標. この座標の左横に情報を得たいオブジェクトの一部が在ってはいけない. [out] rb オブジェクトの情報を格納する境界構造体.
rb->xmin: オブジェクトの x座標の最小値.
rb->xmax: オブジェクトの x座標の最大値.
rb->ymin: オブジェクトの y座標の最小値.
rb->ymax: オブジェクトの y座標の最大値.
rb->misc: 8近傍モード時の斜めの距離の回数. 周囲長を 戻り値 + rb->misc*{sqrt(2.)-1} で計算する場合もある.mode モード.8: 8近傍探索.その他: 4近傍探索.
- Returns
- オブジェクトの周囲長.ただし,8近傍モードの場合,斜めの距離も1と数える.rb->misc 参照.
- Attention
- 注: 1ドットの長さは1と数える.プログラム中で EGMAX+1 を使用.
Definition at line 2021 of file gmt.c.
References WSGraph::gp, JBXL_GRAPH_IVDARG_ERROR, JBXL_GRAPH_IVDMODE_ERROR, JBXL_GRAPH_IVDPARAM_ERROR, Max, Min, IRBound::misc, OFF, ON, IRBound::xmax, IRBound::xmin, WSGraph::xs, IRBound::ymax, and IRBound::ymin.
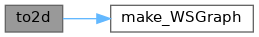
◆ to2d()
WSGraph to2d(WSGraph gd, int mode)
3Dグラフィックを2Dへ射影する(MIP画像).
- Parameters
-
gd 操作対象となる3Dグラフィックデータ構造体. mode モード. SIDEX_VIEW: x方向から射影する.
SIDEY_VIEW: y方向から射影する.
SIDEZ_VIEW: z方向から射影する.
TOP_VIEW: z方向から射影する.
TOP_VIEW_DEPTH: z方向から射影する.ただし,z軸に比例して画像に濃淡を付加する.
- Returns
- 射影された2Dグラフィックデータ(WSGraph, MIP画像)
Definition at line 1781 of file gmt.c.
References WSGraph::gp, JBXL_GRAPH_IVDARG_ERROR, JBXL_GRAPH_NODATA_ERROR, make_WSGraph(), Max, SIDEX_VIEW, SIDEY_VIEW, WSGraph::state, TOP_VIEW, TOP_VIEW_DEPTH, WSGraph::xs, WSGraph::ys, and WSGraph::zs.
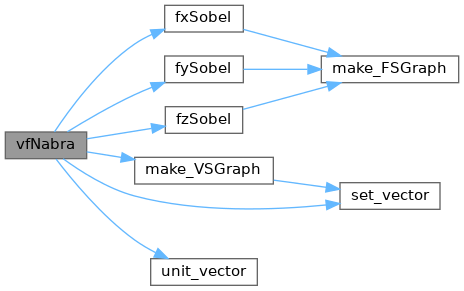
◆ vfNabra()
グラフィックデータの ナブラを実数計算する(Sobel). 精度が上昇するが時間がかかる.
- Parameters
-
vp 計算対象となるグラフィックデータ構造体.
- Returns
- ナブラ.ベクトル型グラフィックデータ.
Definition at line 1012 of file gmt.c.
References free_VSGraph, fxSobel(), fySobel(), fzSobel(), FSGraph::gp, VSGraph::gp, JBXL_GRAPH_NODATA_ERROR, make_VSGraph(), set_vector(), FSGraph::state, VSGraph::state, unit_vector(), FSGraph::xs, FSGraph::ys, and FSGraph::zs.
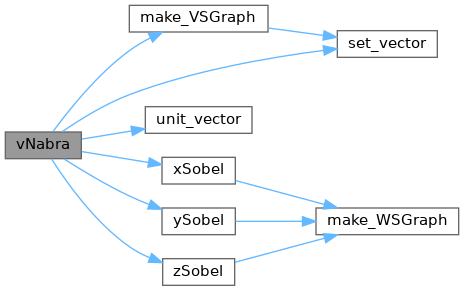
◆ vNabra()
グラフィックデータの ナブラを計算する(Sobel).
- Parameters
-
vp 計算対象となるグラフィックデータ構造体.
- Returns
- ナブラ.ベクトル型グラフィックデータ.
Definition at line 935 of file gmt.c.
References free_VSGraph, WSGraph::gp, VSGraph::gp, JBXL_GRAPH_NODATA_ERROR, make_VSGraph(), set_vector(), WSGraph::state, VSGraph::state, unit_vector(), WSGraph::xs, xSobel(), WSGraph::ys, ySobel(), WSGraph::zs, and zSobel().
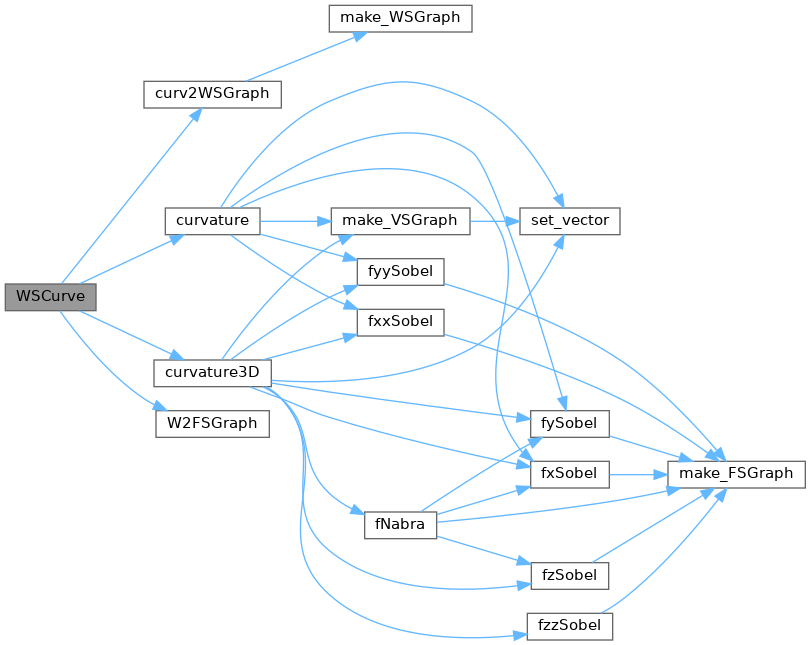
◆ WSCurve()
WSGraph WSCurve(WSGraph gx, int mode, int cc)
曲面の形状をグラフィックデータ(輝度値)に変換する.
- Parameters
-
gx 操作対象となる曲面形状情報3の入ったグラフィックデータ. mode 輝度値に変換する曲面の形状.指定できる形状は ALL, FLAT, PIT, SADDLE_RIDGE, SADDLE_VALLEY, NONE_SHAPE, MINIMAL, RIDGE, VALLEY, PEAK.
ALLを指定した場合,形状は違った輝度値に変換される.cc modeに ALLを指定しなかった場合,指定された曲面をこの輝度値に変換する.
- Returns
- 曲面の形状情報を代入した sWord型グラフィックデータ.
- Note
- FLAT=500, PIT=1000, SADDLE_RIDGE=1500, SADDLE_VALLEY=2000, NONE_SHAPE=2500, MINIMAL=3000, RIDGE=3500, VALLEY=4000, PEAK=4500
Definition at line 1462 of file gmt.c.
References ALL, curv2WSGraph(), curvature(), curvature3D(), FLAT, freeNull, WSGraph::gp, FSGraph::gp, VSGraph::gp, JBXL_GRAPH_NODATA_ERROR, MINIMAL, NONE_SHAPE, PEAK, PIT, RIDGE, SADDLE_RIDGE, SADDLE_VALLEY, WSGraph::state, VALLEY, W2FSGraph(), WSGraph::xs, WSGraph::ys, and WSGraph::zs.
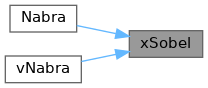
◆ xSobel()
グラフィックデータの x方向微分(Sobel)を計算する.
- Parameters
-
vp 計算対象となるグラフィックデータ構造体.
- Returns
- 処理されたグラフィックデータ.
Definition at line 90 of file gmt.c.
References WSGraph::gp, JBXL_GRAPH_NODATA_ERROR, JBXL_NORMAL, make_WSGraph(), WSGraph::state, Vx, WSGraph::xs, WSGraph::ys, and WSGraph::zs.
Referenced by Nabra(), and vNabra().

◆ xxSobel()
グラフィックデータの x方向の2階微分(Sobel)を計算する.
- Parameters
-
vp 計算対象となるグラフィックデータ構造体.
- Returns
- 処理されたグラフィックデータ.
Definition at line 414 of file gmt.c.
References WSGraph::gp, JBXL_GRAPH_NODATA_ERROR, make_WSGraph(), WSGraph::state, WSGraph::xs, WSGraph::ys, and WSGraph::zs.

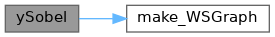
◆ ySobel()
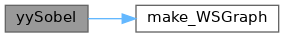
グラフィックデータの y方向微分(Sobel)を計算する.
- Parameters
-
vp 計算対象となるグラフィックデータ構造体.
- Returns
- 処理されたグラフィックデータ.
Definition at line 188 of file gmt.c.
References WSGraph::gp, JBXL_GRAPH_NODATA_ERROR, make_WSGraph(), WSGraph::state, Vx, WSGraph::xs, WSGraph::ys, and WSGraph::zs.
Referenced by Nabra(), and vNabra().

◆ yySobel()
グラフィックデータの y方向の2階微分(Sobel)を計算する.
- Parameters
-
vp 計算対象となるグラフィックデータ構造体.
- Returns
- 処理されたグラフィックデータ.
Definition at line 569 of file gmt.c.
References WSGraph::gp, JBXL_GRAPH_NODATA_ERROR, make_WSGraph(), WSGraph::state, WSGraph::xs, WSGraph::ys, and WSGraph::zs.
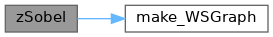
◆ zSobel()
グラフィックデータの z方向微分(Sobel)を計算する.
- Parameters
-
vp 計算対象となるグラフィックデータ構造体.
- Returns
- 処理されたグラフィックデータ.
Definition at line 285 of file gmt.c.
References WSGraph::gp, JBXL_GRAPH_IVDARG_ERROR, JBXL_GRAPH_NODATA_ERROR, make_WSGraph(), WSGraph::state, Vx, WSGraph::xs, WSGraph::ys, and WSGraph::zs.
Referenced by Nabra(), and vNabra().

◆ zzSobel()
グラフィックデータの z方向の2階微分(Sobel)を計算する.
- Parameters
-
vp 計算対象となるグラフィックデータ構造体.
- Returns
- 処理されたグラフィックデータ.
Definition at line 722 of file gmt.c.
References WSGraph::gp, JBXL_GRAPH_IVDARG_ERROR, JBXL_GRAPH_NODATA_ERROR, make_WSGraph(), WSGraph::state, WSGraph::xs, WSGraph::ys, and WSGraph::zs.