JunkBox_Lib  1.10.2
graph.c File Reference

2D & 3D グラフィックライブラリ
More...

#include "graph.h"
#include "jbxl_state.h"
Include dependency graph for graph.c:

Go to the source code of this file.

Functions

int get_idat (WSGraph gd, int xx, int yy, int zz)
 
int get_wdat (WSGraph gd, double xx, double yy, double zz, IRBound rb)
 
int get_bdat (BSGraph gd, int xx, int yy, int zz)
 
void set_idat (WSGraph gd, int ix, int iy, int iz, int cc)
 
void set_wdat (WSGraph gd, double xx, double yy, double zz, int cc, IRBound rb)
 
void set_bdat (BSGraph gd, int ix, int iy, int iz, int cc)
 
void local2world (WSGraph gd, WSGraph vp, vector ox, vector oz, vector ex, double *pcsf, double *psnf)
 
void paint (WSGraph vp, int x, int y, int mn, int mx, int c, int m)
 
void paint3d (WSGraph vp, int x, int y, int z, int mn, int mx, int c, int m)
 
void _paint_3d (WSGraph vp, int x, int y, int z, int mn, int mx, int c, int m)
 
void bline (BSGraph vp, int x1, int y1, int x2, int y2, int cc)
 
void line (WSGraph vp, int x1, int y1, int x2, int y2, int cc)
 
void triangle (WSGraph vp, int x1, int y1, int x2, int y2, int x3, int y3, int cc, int mode)
 
int isinctri (int x1, int y1, int x2, int y2, int x3, int y3, int xx, int yy)
 
void box (WSGraph vp, int x1, int y1, int x2, int y2, int cc, int mode)
 
void bline3d (BSGraph gd, int x1, int y1, int z1, int x2, int y2, int z2, int cc)
 
void line3d (WSGraph gd, int x1, int y1, int z1, int x2, int y2, int z2, int cc)
 
void circle (WSGraph gd, int x, int y, int r, int cc, int mode)
 
void circle3d (WSGraph gd, vector ox, vector ex, int rr, int cc, int mode)
 
void pool (WSGraph gd, vector a, vector b, int rr, int cc)
 
void torus (WSGraph gd, vector ox, vector ex, int rr, int ra, int cc)
 
void sphere (WSGraph vp, vector a, int r, int cc, int mode)
 
WSGraph x_reverse_wsg (WSGraph vp)
 
void topola (vector nv, double *cst, double *snt, double *csf, double *snf)
 
WSGraph cut_object (WSGraph vp, int cc, IRBound *rb, int blank)
 
void set_around (WSGraph vp, int cc)
 
WSGraph zoom_WSGraph (WSGraph vp, int zm, int mode)
 
WSGraph grab_WSGraph (WSGraph vp, int x1, int y1, int x2, int y2)
 
void copy_WSGraph (WSGraph src, WSGraph dst)
 

Detailed Description

Version
3.0
Author
Fumi.Iseki (C)

Definition in file graph.c.

Function Documentation
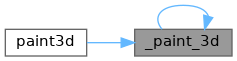
◆ _paint_3d()

void _paint_3d ( WSGraph  vp,
int  x,
int  y,
int  z,
int  mn,
int  mx,
int  c,
int  m 
)

void _paint_3d(WSGraph vp, int x, int y, int z, int mn, int mx, int c, int m)

paint3d() の補助関数

Definition at line 350 of file graph.c.

351 {
352  int i, j, ps, cc;
353  WSGraph xp;
354 
355  ps = vp.xs*vp.ys;
356  xp.xs = vp.xs;
357  xp.ys = vp.ys;
358  xp.zs = 1;
359  xp.gp = &(vp.gp[z*ps]);
360  xp.state = vp.state;
361 
362  cc = xp.gp[y*xp.xs+x];
363  if (cc>mx || cc<mn) return;
364  paint(xp, x, y, mn, mx, c, m);
365  if (m<0) {
366  DEBUG_MODE fprintf(stderr,"_paint_3d: zz = %d\n",z);
367  }
368 
369  for (i=0; i<ps; i++) {
370  if (xp.gp[i]==c) {
371  x = i%vp.xs;
372  y = i/vp.xs;
373  if (z-1>=0) {
374  j = (z-1)*ps+y*vp.xs+x;
375  if (vp.gp[j]<=mx && vp.gp[j]>=mn) _paint_3d(vp, x, y, z-1, mn, mx, c, m);
376  }
377  if (z+1<vp.zs) {
378  j = (z+1)*ps+y*vp.xs+x;
379  if (vp.gp[j]<=mx && vp.gp[j]>=mn) _paint_3d(vp, x, y, z+1, mn, mx, c, m);
380  }
381  }
382  }
383 
384  return;
385 }
void paint(WSGraph vp, int x, int y, int mn, int mx, int c, int m)
Definition: graph.c:247
void _paint_3d(WSGraph vp, int x, int y, int z, int mn, int mx, int c, int m)
Definition: graph.c:350
Definition: gdata.h:42
int zs
zサイズ. 4Byte. 2Dの場合は 1.
Definition: gdata.h:45
int xs
xサイズ. 4Byte.
Definition: gdata.h:43
int state
状態
Definition: gdata.h:46
sWord * gp
グラフィックデータへのポインタ. xs*ys*zs*2Byte.
Definition: gdata.h:47
int ys
yサイズ. 4Byte.
Definition: gdata.h:44
#define DEBUG_MODE
Definition: tools.h:502

References DEBUG_MODE, WSGraph::gp, paint(), WSGraph::state, WSGraph::xs, WSGraph::ys, and WSGraph::zs.

Referenced by paint3d().

Here is the call graph for this function:
Here is the caller graph for this function:

◆ bline()

void bline ( BSGraph  vp,
int  x1,
int  y1,
int  x2,
int  y2,
int  cc 
)

void bline(BSGraph vp, int x1, int y1, int x2, int y2, int cc)

2Dのラインの描画.
点(x1,y1)から点(x2,y2)へ濃度 ccの線を引く.

Parameters
vp操作対象となるグラフィックデータ構造体.
x1,y1線の始点の座標.
x2,y2線の終点の座標.
cc線の濃度.
使用例
line(vp, 100, 200, 300, 300, 200); // (100,200)から(300,300)へ濃度 200の線を引く
void line(WSGraph vp, int x1, int y1, int x2, int y2, int cc)
Definition: graph.c:462

Definition at line 404 of file graph.c.

405 {
406  int thresh=0, index;
407  int xunit=1;
408  int yunit=1;
409  int xdiff=x2-x1;
410  int ydiff=y2-y1;
411 
412  if (xdiff<0) {
413  xdiff = -xdiff;
414  xunit = -1;
415  }
416  if (ydiff<0) {
417  ydiff = -ydiff;
418  yunit = -1;
419  }
420 
421  if (xdiff>ydiff) {
422  for (index=0; index<xdiff+1; index++) {
423  set_bdat(vp, x1, y1, 0, cc);
424  x1 = x1 + xunit;
425  thresh = thresh + ydiff;
426  if (thresh>=xdiff) {
427  thresh = thresh - xdiff;
428  y1 = y1 + yunit;
429  }
430  }
431  }
432  else {
433  for (index=0; index<ydiff+1; index++) {
434  set_bdat(vp, x1, y1, 0, cc);
435  y1 = y1 + yunit;
436  thresh = thresh + xdiff;
437  if (thresh>=ydiff) {
438  thresh = thresh - ydiff;
439  x1 = x1 + xunit;
440  }
441  }
442  }
443 }
void set_bdat(BSGraph gd, int ix, int iy, int iz, int cc)
Definition: graph.c:166

References set_bdat().

Here is the call graph for this function:

◆ bline3d()

void bline3d ( BSGraph  gd,
int  x1,
int  y1,
int  z1,
int  x2,
int  y2,
int  z2,
int  cc 
)

void bline3d(BSGraph gd, int x1, int y1, int z1, int x2, int y2, int z2, int cc)

3Dのラインの描画.点(x1,y1,z1)から点(x2,y2,z2)へ濃度 ccの線を引く.

Parameters
gd操作対象となるグラフィックデータ構造体.
x1,y1,z1線の始点の座標.
x2,y2,z2線の終点の座標.
cc線の濃度.

Definition at line 613 of file graph.c.

614 {
615  int i;
616  int xx, yy, zz, dx, dy, dz;
617  int ux=1, uy=1, uz=1;
618  int sx=0, sy=0, sz=0;
619 
620  dx = x2 - x1;
621  dy = y2 - y1;
622  dz = z2 - z1;
623 
624  if (dx<0) {
625  dx = -dx;
626  ux = -1;
627  }
628  if (dy<0) {
629  dy = -dy;
630  uy = -1;
631  }
632  if (dz<0) {
633  dz = -dz;
634  uz = -1;
635  }
636 
637  xx = x1;
638  yy = y1;
639  zz = z1;
640 
641  set_bdat(gd, xx, yy, zz, cc);
642  if (dx>=dy && dx>=dz) {
643  for (i=1; i<=dx; i++) {
644  xx = xx + ux;
645  sy = sy + dy;
646  sz = sz + dz;
647  if (sy>dx) {
648  sy = sy - dx;
649  yy = yy + uy;
650  }
651  if (sz>dx) {
652  sz = sz - dx;
653  zz = zz + uz;
654  }
655  set_bdat(gd, xx, yy, zz, cc);
656  }
657  }
658  else if (dy>dx && dy>=dz) {
659  for (i=1; i<=dy; i++) {
660  yy = yy + uy;
661  sx = sx + dx;
662  sz = sz + dz;
663  if (sx>dy) {
664  sx = sx - dy;
665  xx = xx + ux;
666  }
667  if (sz>dy) {
668  sz = sz - dy;
669  zz = zz + uz;
670  }
671  set_bdat(gd, xx, yy, zz, cc);
672  }
673  }
674  else {
675  for (i=1; i<=dz; i++) {
676  zz = zz + uz;
677  sx = sx + dx;
678  sy = sy + dy;
679  if (sx>dz) {
680  sx = sx - dz;
681  xx = xx + ux;
682  }
683  if (sy>dz) {
684  sy = sy - dz;
685  yy = yy + uy;
686  }
687  set_bdat(gd, xx, yy, zz, cc);
688  }
689  }
690 }

References set_bdat().

Referenced by draw_shape_polygon().
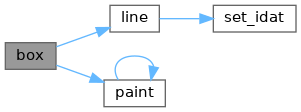
Here is the call graph for this function:
Here is the caller graph for this function:

◆ box()

void box ( WSGraph  vp,
int  x1,
int  y1,
int  x2,
int  y2,
int  cc,
int  mode 
)

void box(WSGraph vp, int x1, int y1, int x2, int y2, int cc, int mode)

点(x1,y1)-(x2,y2)を対角とした四角形を描く.線の濃度は cc.
modeが 1以上なら,四角形の内部を塗りつぶす.

Parameters
vp操作対象となるグラフィックデータ構造体.
(x1,y1)-(x2,y2)四角形の対角の座標.
cc線の濃度.
modeON なら四角形の内部の0〜ccをccで塗りつぶす.
使用例
box(vp, 100, 100, 200, 200, 1000, 0); // (100,100),(200,200)を対角とした四角形を描く
void box(WSGraph vp, int x1, int y1, int x2, int y2, int cc, int mode)
Definition: graph.c:589

Definition at line 589 of file graph.c.

590 {
591  line(vp, x1, y1, x2, y1, cc);
592  line(vp, x2, y1, x2, y2, cc);
593  line(vp, x2, y2, x1, y2, cc);
594  line(vp, x1, y2, x1, y1, cc);
595 
596  if (mode==ON) {
597  paint(vp, (x1+x2)/2, (y1+y2)/2, 0, cc-1, cc, 4);
598  }
599  return;
600 }
#define ON
Definition: common.h:230

References line(), ON, and paint().
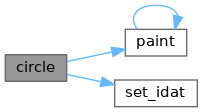
Here is the call graph for this function:

◆ circle()

void circle ( WSGraph  gd,
int  x,
int  y,
int  r,
int  cc,
int  mode 
)

void circle(WSGraph gd, int x, int y, int r, int cc, int mode)

2Dの円の描画.点(x,y)を中心に半径rで濃度 ccの円を書く.

Parameters
gd操作対象となるグラフィックデータ構造体.
x,y円の中心の座標.
r円の半径.
cc線の濃度.
modeON なら円の内部の 0〜ccを ccで塗りつぶす.

Definition at line 794 of file graph.c.

795 {
796  double yy, dy, dt;
797  int i, nn, cx;
798  int ix, iy, ux=1;
799  int *px, *py;
800 
801  if (r<=0) return;
802 
803  px = (int*)malloc(sizeof(int)*(r+1));
804  py = (int*)malloc(sizeof(int)*(r+1));
805  if (px==NULL || py==NULL) {
806  if (px!=NULL) free(px);
807  if (py!=NULL) free(py);
808  return;
809  }
810  memset(px, 0, sizeof(int)*(r+1));
811  memset(py, 0, sizeof(int)*(r+1));
812 
813  ix = 0;
814  iy = r;
815  yy = (double)r;
816  nn = 0;
817  px[0] = ix;
818  py[0] = iy;
819 
820  cx = (y+iy)*gd.xs + (x+ix);
821  gd.gp[cx] = cc;
822  while(iy>=ix) {
823  ix = ix + ux;
824  dt = -ux/yy;
825  dy = ix*dt;
826  yy = yy + dy;
827  iy = (int)yy;
828 
829  set_idat(gd, x+ix, y+iy, 0, cc);
830  nn++;
831  px[nn] = ix;
832  py[nn] = iy;
833  }
834 
835  for (i=0; i<=nn; i++) {
836  ix = py[nn-i];
837  iy = px[nn-i];
838  set_idat(gd, x+ix, y+iy, 0, cc);
839  }
840 
841  for (i=0; i<=nn; i++) {
842  ix = py[i];
843  iy = -px[i];
844  set_idat(gd, x+ix, y+iy, 0, cc);
845  }
846 
847  for (i=0; i<=nn; i++) {
848  ix = px[nn-i];
849  iy = -py[nn-i];
850  set_idat(gd, x+ix, y+iy, 0, cc);
851  }
852 
853  for (i=0; i<=nn; i++) {
854  ix = -px[i];
855  iy = -py[i];
856  set_idat(gd, x+ix, y+iy, 0, cc);
857  }
858 
859  for (i=0; i<=nn; i++) {
860  ix = -py[nn-i];
861  iy = -px[nn-i];
862  set_idat(gd, x+ix, y+iy, 0, cc);
863  }
864 
865  for (i=0; i<=nn; i++) {
866  ix = -py[i];
867  iy = px[i];
868  set_idat(gd, x+ix, y+iy, 0, cc);
869  }
870 
871  for (i=0; i<=nn; i++) {
872  ix = -px[nn-i];
873  iy = py[nn-i];
874  set_idat(gd, x+ix, y+iy, 0, cc);
875  }
876 
877  if (mode==ON) paint(gd, x, y, 0, cc-1, cc, 4);
878 
879  free(px);
880  free(py);
881 }
void set_idat(WSGraph gd, int ix, int iy, int iz, int cc)
Definition: graph.c:96

References WSGraph::gp, ON, paint(), set_idat(), and WSGraph::xs.

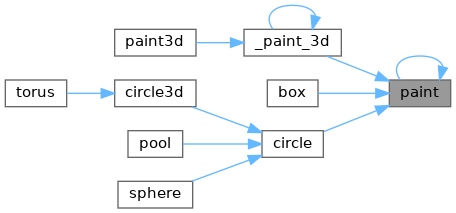
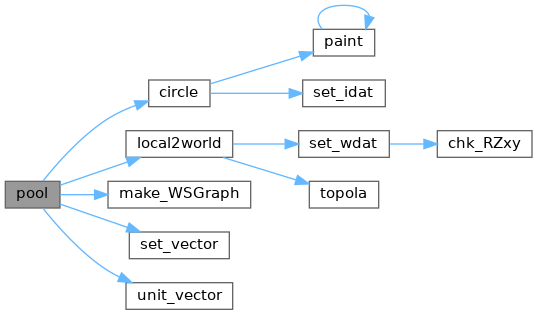
Referenced by circle3d(), pool(), and sphere().
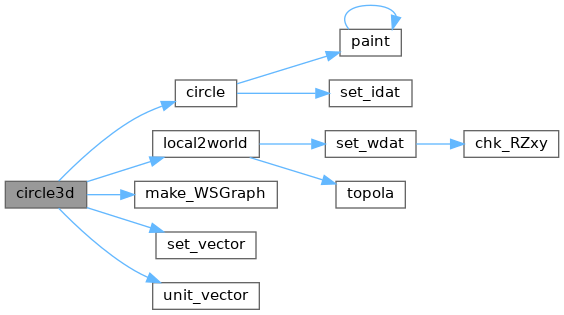
Here is the call graph for this function:
Here is the caller graph for this function:

◆ circle3d()

void circle3d ( WSGraph  gd,
vector  ox,
vector  ex,
int  rr,
int  cc,
int  mode 
)

void circle3d(WSGraph vp, vector ox, vector ex, int rr, int cc, int mode)

3D的な円の描画.

Parameters
gd操作対象となるグラフィックデータ構造体.
ox円の中心の座標ベクトル.
ex円の中心の法線ベクトル.
rr円の半径.
cc線の濃度.
modeON なら円の内部の 0〜ccを ccで塗りつぶす.

Definition at line 896 of file graph.c.

897 {
898  vector oz;
899  WSGraph vp;
900 
901  vp = make_WSGraph(2*rr+3, 2*rr+3, 1);
902  if (vp.gp==NULL) return;
903  circle(vp, rr+1, rr+1, rr, cc, mode);
904 
905  oz = set_vector((vp.xs-1)/2., (vp.ys-1)/2., 0.0);
906  ex = unit_vector(ex);
907  local2world(gd, vp, ox, oz, ex, NULL, NULL);
908 
909  free(vp.gp);
910 }
WSGraph make_WSGraph(int xs, int ys, int zs)
Definition: gdata.c:108
void local2world(WSGraph gd, WSGraph vp, vector ox, vector oz, vector ex, double *pcsf, double *psnf)
Definition: graph.c:189
void circle(WSGraph gd, int x, int y, int r, int cc, int mode)
Definition: graph.c:794
vector unit_vector(vector a)
Definition: matrix.c:18
vector set_vector(double x, double y, double z)
Definition: matrix.c:82
Definition: matrix.h:29

References circle(), WSGraph::gp, local2world(), make_WSGraph(), set_vector(), unit_vector(), WSGraph::xs, and WSGraph::ys.

Referenced by torus().

Here is the call graph for this function:
Here is the caller graph for this function:

◆ copy_WSGraph()

void copy_WSGraph ( WSGraph  src,
WSGraph  dst 
)

void copy_WSGraph(WSGraph src, WSGraph dst)

WSGraph型データのバッファ部をコピーする.とにかくコピーする.できるだけコピーする.

コピー元とコピー先のバッファ部のサイズが合わない場合,コピー結果は保証されない.

Parameters
srcコピー元グラフィックデータ
dstコピー先グラフィックデータ

Definition at line 1352 of file graph.c.

1353 {
1354  int i, ssz, dsz, sz;
1355 
1356  if (src.zs<=0) src.zs = 1;
1357  if (dst.zs<=0) dst.zs = 1;
1358  ssz = src.xs*src.ys*src.zs;
1359  dsz = dst.xs*dst.ys*dst.zs;
1360  sz = Min(ssz, dsz);
1361 
1362  for (i=0; i<sz; i++) dst.gp[i] = src.gp[i];
1363  for (i=sz; i<dsz; i++) dst.gp[i] = 0;
1364  return;
1365 }
#define Min(x, y)
Definition: common.h:250

References WSGraph::gp, Min, WSGraph::xs, WSGraph::ys, and WSGraph::zs.

◆ cut_object()

WSGraph cut_object ( WSGraph  vp,
int  cc,
IRBound rb,
int  blank 
)

WSGraph cut_object(WSGraph vp, int cc, IRBound* rb, int blank)

グラフィックデータから cc以上の輝度値を持つ部分を抜き出す.

Parameters
vp操作対象となるグラフィックデータ構造体.
cc抜き出す画像の輝度値.これ以上御輝度値部分を抜き出す.
[out]rb指定しない.抜き出された画像の境界情報が入る.
blank余白
Returns
抜き出されたグラフィックデータ.

Definition at line 1150 of file graph.c.

1151 {
1152  int i, j, k, cx, ax;
1153  WSGraph xp;
1154 
1155  init_IRBound(rb);
1156 
1157  for (i=0; i<vp.xs; i++)
1158  for (j=0; j<vp.ys; j++)
1159  for (k=0; k<vp.zs; k++) {
1160  cx = vp.xs*vp.ys*k + vp.xs*j + i;
1161  if (vp.gp[cx]>=cc) {
1162  rb->xmax = Max(rb->xmax, i);
1163  rb->ymax = Max(rb->ymax, j);
1164  rb->zmax = Max(rb->zmax, k);
1165  rb->xmin = Min(rb->xmin, i);
1166  rb->ymin = Min(rb->ymin, j);
1167  rb->zmin = Min(rb->zmin, k);
1168  }
1169  }
1170 
1171  if (blank!=0) {
1172  rb->xmax += blank;
1173  rb->ymax += blank;
1174  rb->zmax += blank;
1175  rb->xmin -= blank;
1176  rb->ymin -= blank;
1177  rb->zmin -= blank;
1178  rb->xmin = Max(rb->xmin, 0);
1179  rb->ymin = Max(rb->ymin, 0);
1180  rb->zmin = Max(rb->zmin, 0);
1181  rb->zmax = Min(rb->zmax, vp.zs-1);
1182  }
1183 
1184  xp.xs = rb->xmax - rb->xmin + 1;
1185  xp.ys = rb->ymax - rb->ymin + 1;
1186  xp.zs = rb->zmax - rb->zmin + 1;
1187  xp = make_WSGraph(xp.xs, xp.ys, xp.zs);
1188  if (xp.gp==NULL) {
1190  return xp;
1191  }
1192 
1193  for (i=0; i<xp.xs; i++) {
1194  for (j=0; j<xp.ys; j++) {
1195  for (k=0; k<xp.zs; k++) {
1196  cx = xp.xs*xp.ys*k + xp.xs*j + i;
1197  ax = vp.xs*vp.ys*(k+rb->zmin) + vp.xs*(j+rb->ymin) + (i+rb->xmin);
1198  if (vp.gp[ax]>=cc) xp.gp[cx] = vp.gp[ax];
1199  }
1200  }
1201  }
1202 
1203  return xp;
1204 }
#define Max(x, y)
Definition: common.h:247
void init_IRBound(IRBound *rb)
Definition: gdata.c:787
#define JBXL_GRAPH_MEMORY_ERROR
メモリエラー
Definition: jbxl_state.h:170
int xmax
x軸境界の最大値.
Definition: gdata.h:115
int ymax
y軸境界の最大値.
Definition: gdata.h:117
int xmin
x軸境界の最小値.
Definition: gdata.h:114
int ymin
y軸境界の最小値.
Definition: gdata.h:116
int zmax
z軸境界の最大値.
Definition: gdata.h:119
int zmin
z軸境界の最小値.
Definition: gdata.h:118

References WSGraph::gp, init_IRBound(), JBXL_GRAPH_MEMORY_ERROR, make_WSGraph(), Max, Min, WSGraph::state, IRBound::xmax, IRBound::xmin, WSGraph::xs, IRBound::ymax, IRBound::ymin, WSGraph::ys, IRBound::zmax, IRBound::zmin, and WSGraph::zs.

Here is the call graph for this function:

◆ get_bdat()

int get_bdat ( BSGraph  gd,
int  xx,
int  yy,
int  zz 
)

int get_bdat(BSGraph gd, int xx, int yy, int zz)

グラフィックデータ構造体 vpの任意の 1voxelの値(濃度)を返す.
座標の範囲チェックあり.Z軸の歪補整はなし.

Parameters
gd操作対象となるグラフィックデータ構造体.
xx,yy,zz値を設定する xyz座標.
Returns
(xx,yy,zz)点の濃度(輝度値).(xx,yy,zz)が座標の範囲外の場合は0を返す.

Definition at line 75 of file graph.c.

76 {
77  int ret = 0;
78 
79  if (xx>0&&yy>0&&zz>0&&xx<gd.xs&&yy<gd.ys&&zz<gd.zs) {
80  ret = (int)gd.gp[zz*gd.xs*gd.ys + yy*gd.xs + xx];
81  }
82  return ret;
83 }
int zs
zサイズ. 4Byte. 2Dの場合は 1.
Definition: gdata.h:30
int xs
xサイズ. 4Byte.
Definition: gdata.h:28
uByte * gp
グラフィックデータへのポインタ. xs*ys*zs*1Byte.
Definition: gdata.h:32
int ys
yサイズ. 4Byte.
Definition: gdata.h:29

References BSGraph::gp, BSGraph::xs, BSGraph::ys, and BSGraph::zs.

◆ get_idat()

int get_idat ( WSGraph  gd,
int  xx,
int  yy,
int  zz 
)

int get_idat(WSGraph gd, int xx, int yy, int zz)

グラフィックデータ構造体 vpの任意の 1voxelの値(濃度)を返す.
座標の範囲チェックあり.Z軸の歪補整はなし.

Parameters
gd操作対象となるグラフィックデータ構造体.
xx,yy,zz値を設定する xyz座標.
Returns
(xx,yy,zz)点の濃度(輝度値).(xx,yy,zz)が座標の範囲外の場合は0を返す.

Definition at line 23 of file graph.c.

24 {
25  int ret = 0;
26 
27  if (xx>0&&yy>0&&zz>0&&xx<gd.xs&&yy<gd.ys&&zz<gd.zs) {
28  ret = gd.gp[zz*gd.xs*gd.ys + yy*gd.xs + xx];
29  }
30  return ret;
31 }

References WSGraph::gp, WSGraph::xs, WSGraph::ys, and WSGraph::zs.

◆ get_wdat()

int get_wdat ( WSGraph  gd,
double  xx,
double  yy,
double  zz,
IRBound  rb 
)

int get_wdat(WSGraph gd, double xx, double yy, double zz, IRBound rb)

グラフィックデータ構造体 vpの任意の 1voxelの値(濃度)を返す.
座標の範囲チェックあり.Z軸の歪補整あり(RZxy).

Parameters
gd操作対象となるグラフィックデータ構造体.
xx,yy,zz値を設定する xyz座標.
rb境界の底上げ値.rb.?min を基底値にする.
Returns
(xx,yy,zz)点の濃度(輝度値).(xx,yy,zz)が座標の範囲外の場合は0を返す.

Definition at line 46 of file graph.c.

47 {
48  int ix, iy, iz;
49  int ret = 0;
50 
51  if (chk_RZxy()) zz = zz*RZxy; // (ex. *0.4/2.0)
52 
53  ix = (int)(xx+0.5) - rb.xmin;
54  iy = (int)(yy+0.5) - rb.ymin;
55  iz = (int)(zz+0.5) - rb.zmin;
56 
57  if (ix>=0&&ix<gd.xs&&iy>=0&&iy<gd.ys&&iz>=0&&iz<gd.zs){
58  ret = gd.gp[iz*gd.xs*gd.ys + iy*gd.xs + ix];
59  }
60  return ret;
61 }
double RZxy
Definition: gdata.c:15
int chk_RZxy(void)
Definition: gdata.c:832

References chk_RZxy(), WSGraph::gp, RZxy, IRBound::xmin, WSGraph::xs, IRBound::ymin, WSGraph::ys, IRBound::zmin, and WSGraph::zs.

Here is the call graph for this function:

◆ grab_WSGraph()

WSGraph grab_WSGraph ( WSGraph  vp,
int  x1,
int  y1,
int  x2,
int  y2 
)

WSGraph grab_WSGraph(WSGraph vp, int x1, int y1, int x2, int y2)

WSGraph型データの (x1,y1)-(x2,y2)の矩形部分だけを取り出す.

(x1,y1)-(x2,y2)が元のデータのサイズを越える場合は,元のデータに合わせられる.

Parameters
vp操作対象グラフィックデータ
(x1,y1),(x2,y2)矩形の対角の座標.
Returns
取り出したグラフィックデータ.

Definition at line 1311 of file graph.c.

1312 {
1313  int i, j, xs, xe, ys, ye, xsize, ysize;
1314  WSGraph xp;
1315 
1316  xs = Min(x1, x2);
1317  xe = Max(x1, x2);
1318  xe = Min(xe, vp.xs-1);
1319  ys = Min(y1, y2);
1320  ye = Max(y1, y2);
1321  ye = Min(ye, vp.ys-1);
1322  xsize = xe - xs + 1;
1323  ysize = ye - ys + 1;
1324 
1325  xp = make_WSGraph(xsize, ysize, 1);
1326  if (xp.gp==NULL) {
1327  memset(&xp, 0, sizeof(WSGraph));
1329  return xp;
1330  }
1331 
1332  for (j=0; j<ysize; j++) {
1333  for (i=0; i<xsize; i++) {
1334  Px(xp, i, j) = Px(vp, i+xs, j+ys);
1335  }
1336  }
1337 
1338  return xp;
1339 }
#define Px(v, i, j)
2次元画像データ vの (i, j) のデータを参照する.
Definition: gdata.h:192

References WSGraph::gp, JBXL_GRAPH_MEMORY_ERROR, make_WSGraph(), Max, Min, Px, WSGraph::state, WSGraph::xs, and WSGraph::ys.

Here is the call graph for this function:

◆ isinctri()

int isinctri ( int  x1,
int  y1,
int  x2,
int  y2,
int  x3,
int  y3,
int  xx,
int  yy 
)

int isinctri(int x1, int y1, int x2, int y2, int x3, int y3, int xx, int yy)

点(xx, yy) が三角形の中に含まれているか判定する

Return values
TRUE(xx,yy) は三角形 (x1,y1)-(x2,y2)-(x3,y3)の内部にある.
FALSE(xx,yy) は三角形 (x1,y1)-(x2,y2)-(x3,y3)の内部にない.

Definition at line 559 of file graph.c.

560 {
561  int cx, cy;
562 
563  cx = (x1 + x2 + x3)/3;
564  cy = (y1 + y2 + y3)/3;
565 
566  if (isCrossLine(x1, y1, x2, y2, xx, yy, cx, cy)<0) return FALSE;
567  if (isCrossLine(x1, y1, x3, y3, xx, yy, cx, cy)<0) return FALSE;
568  if (isCrossLine(x2, y2, x3, y3, xx, yy, cx, cy)<0) return FALSE;
569  return TRUE;
570 }
#define TRUE
Definition: common.h:226
#define FALSE
Definition: common.h:223
#define isCrossLine(x1, y1, x2, y2, x3, y3, x4, y4)
Definition: graph.h:104

References FALSE, isCrossLine, and TRUE.

Referenced by triangle().

Here is the caller graph for this function:

◆ line()

void line ( WSGraph  vp,
int  x1,
int  y1,
int  x2,
int  y2,
int  cc 
)

void line(WSGraph vp, int x1, int y1, int x2, int y2, int cc)

2Dのラインの描画.
点(x1,y1)から点(x2,y2)へ濃度 ccの線を引く.

Parameters
vp操作対象となるグラフィックデータ構造体.
x1,y1線の始点の座標.
x2,y2線の終点の座標.
cc線の濃度.
使用例
line(vp, 100, 200, 300, 300, 200); // (100,200)から(300,300)へ濃度 200の線を引く

Definition at line 462 of file graph.c.

463 {
464  int thresh=0, index;
465  int xunit=1;
466  int yunit=1;
467  int xdiff=x2-x1;
468  int ydiff=y2-y1;
469 
470  if (xdiff<0) {
471  xdiff = -xdiff;
472  xunit = -1;
473  }
474  if (ydiff<0) {
475  ydiff = -ydiff;
476  yunit = -1;
477  }
478 
479  if (xdiff>ydiff) {
480  for (index=0; index<xdiff+1; index++) {
481  set_idat(vp, x1, y1, 0, cc);
482  x1 = x1 + xunit;
483  thresh = thresh + ydiff;
484  if (thresh>=xdiff) {
485  thresh = thresh - xdiff;
486  y1 = y1 + yunit;
487  }
488  }
489  }
490  else {
491  for (index=0; index<ydiff+1; index++) {
492  set_idat(vp, x1, y1, 0, cc);
493  y1 = y1 + yunit;
494  thresh = thresh + xdiff;
495  if (thresh>=ydiff) {
496  thresh = thresh - ydiff;
497  x1 = x1 + xunit;
498  }
499  }
500  }
501 }

References set_idat().

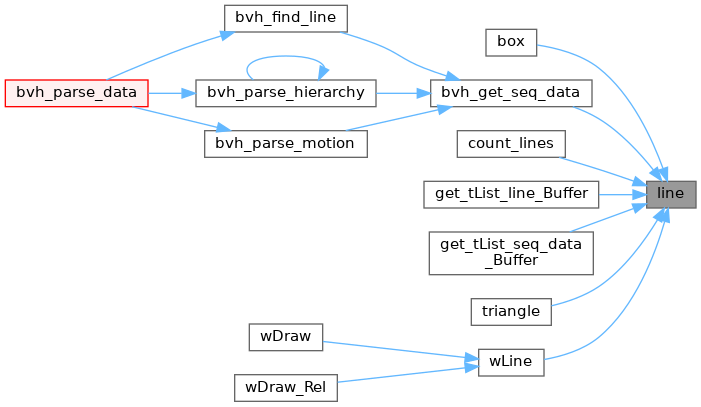
Referenced by box(), bvh_get_seq_data(), count_lines(), get_tList_line_Buffer(), get_tList_seq_data_Buffer(), triangle(), and wLine().

Here is the call graph for this function:
Here is the caller graph for this function:

◆ line3d()

void line3d ( WSGraph  gd,
int  x1,
int  y1,
int  z1,
int  x2,
int  y2,
int  z2,
int  cc 
)

void line3d(WSGraph gd, int x1, int y1, int z1, int x2, int y2, int z2, int cc)

3Dのラインの描画.点(x1,y1,z1)から点(x2,y2,z2)へ濃度 ccの線を引く.

Parameters
gd操作対象となるグラフィックデータ構造体.
x1,y1,z1線の始点の座標.
x2,y2,z2線の終点の座標.
cc線の濃度.

Definition at line 703 of file graph.c.

704 {
705  int i;
706  int xx, yy, zz, dx, dy, dz;
707  int ux=1, uy=1, uz=1;
708  int sx=0, sy=0, sz=0;
709 
710  dx = x2 - x1;
711  dy = y2 - y1;
712  dz = z2 - z1;
713 
714  if (dx<0) {
715  dx = -dx;
716  ux = -1;
717  }
718  if (dy<0) {
719  dy = -dy;
720  uy = -1;
721  }
722  if (dz<0) {
723  dz = -dz;
724  uz = -1;
725  }
726 
727  xx = x1;
728  yy = y1;
729  zz = z1;
730 
731  set_idat(gd, xx, yy, zz, cc);
732  if (dx>=dy && dx>=dz) {
733  for (i=1; i<=dx; i++) {
734  xx = xx + ux;
735  sy = sy + dy;
736  sz = sz + dz;
737  if (sy>dx) {
738  sy = sy - dx;
739  yy = yy + uy;
740  }
741  if (sz>dx) {
742  sz = sz - dx;
743  zz = zz + uz;
744  }
745  set_idat(gd, xx, yy, zz, cc);
746  }
747  }
748  else if (dy>dx && dy>=dz) {
749  for (i=1; i<=dy; i++) {
750  yy = yy + uy;
751  sx = sx + dx;
752  sz = sz + dz;
753  if (sx>dy) {
754  sx = sx - dy;
755  xx = xx + ux;
756  }
757  if (sz>dy) {
758  sz = sz - dy;
759  zz = zz + uz;
760  }
761  set_idat(gd, xx, yy, zz, cc);
762  }
763  }
764  else {
765  for (i=1; i<=dz; i++) {
766  zz = zz + uz;
767  sx = sx + dx;
768  sy = sy + dy;
769  if (sx>dz) {
770  sx = sx - dz;
771  xx = xx + ux;
772  }
773  if (sy>dz) {
774  sy = sy - dz;
775  yy = yy + uy;
776  }
777  set_idat(gd, xx, yy, zz, cc);
778  }
779  }
780 }

References set_idat().

Here is the call graph for this function:

◆ local2world()

void local2world ( WSGraph  gd,
WSGraph  vp,
vector  ox,
vector  oz,
vector  ex,
double *  pcsf,
double *  psnf 
)

void local2world(WSGraph gd, WSGraph vp, vector ox, vector oz, vector ex, double* pcsf, double* psnf)

ロカール座標系のグラフィック vpをグローバル座標系のグラフィック gdに埋めこむ.

Parameters
gdグローバル座標系のグラフィックデータ構造体.
vpローカル座標系のグラフィックデータ構造体.
oxgdvpの原点の座標.
ozgdから見た vpの原点の座標.
exgdから見た vpの座標の向き.
[in,out]pcsf通常は cosφの値が入る. sinθが0に近い場合は計算しないので,連続計算の場合は予め直前の cosφの値を入れて置く.
[in,out]psnf通常は sinφの値が入る. sinθが0に近い場合は計算しないので,連続計算の場合は予め直前の sinφの値を入れて置く.

Definition at line 189 of file graph.c.

190 {
191  int x, y, z, cx, cy, cz;
192  double px, py, pz, xx, yy, zz;
193  double cst, snt, csf=0.0, snf=1.0;
194  IRBound rb;
195 
196  if (pcsf!=NULL && psnf!=NULL) {
197  csf = *pcsf;
198  snf = *psnf;
199  }
200 
201  rb.xmin = rb.ymin = rb.zmin = 0;
202  rb.misc = ON;
203  topola(ex, &cst, &snt, &csf, &snf);
204 
205  for(z=0; z<vp.zs; z++) {
206  cz = z*vp.xs*vp.ys;
207  for(y=0; y<vp.ys; y++) {
208  cy = cz + y*vp.xs;
209  for(x=0; x<vp.xs; x++) {
210  cx = cy + x;
211  if(vp.gp[cx]!=0) {
212  px = z - oz.z;
213  py = oz.x - x;
214  pz = oz.y - y;
215  xx = px*snt*csf - py*snf - pz*cst*csf + ox.x;
216  yy = px*snt*snf + py*csf - pz*cst*snf + ox.y;
217  zz = px*cst + pz*snt + ox.z;
218  set_wdat(gd, xx, yy, zz, vp.gp[cx], rb);
219  }
220  }
221  }
222  }
223 
224  if (pcsf!=NULL && psnf!=NULL) {
225  *pcsf = csf;
226  *psnf = snf;
227  }
228 }
void set_wdat(WSGraph gd, double xx, double yy, double zz, int cc, IRBound rb)
Definition: graph.c:117
void topola(vector nv, double *cst, double *snt, double *csf, double *snf)
Definition: graph.c:1111
Definition: gdata.h:113
int misc
多目的用.
Definition: gdata.h:120
double z
z方向成分
Definition: matrix.h:32
double y
y方向成分
Definition: matrix.h:31
double x
x方向成分
Definition: matrix.h:30

References WSGraph::gp, IRBound::misc, ON, set_wdat(), topola(), vector::x, IRBound::xmin, WSGraph::xs, vector::y, IRBound::ymin, WSGraph::ys, vector::z, IRBound::zmin, and WSGraph::zs.

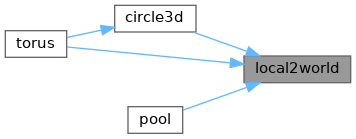
Referenced by circle3d(), pool(), and torus().

Here is the call graph for this function:
Here is the caller graph for this function:

◆ paint()

void paint ( WSGraph  vp,
int  x,
int  y,
int  mn,
int  mx,
int  c,
int  m 
)

void paint(WSGraph vp, int x, int y, int mn, int mx, int c, int m)

2Dグラフィックの塗りつぶし.
2Dグラフィック vpの点(x,y)から始めて, mn〜mx の輝度値を c で塗りつぶす.

Parameters
vpグラフィックデータ構造体.
x塗りつぶしを始める点の x座標.
y塗りつぶしを始める点の y座標.
mn塗りつぶされる輝度値の最小値
mx塗りつぶされる輝度値の最大値.
c塗りつぶしの輝度値.
mモード
8: 8近傍の塗りつぶし
その他: 4近傍の塗りつぶし

Definition at line 247 of file graph.c.

248 {
249  int i, j, k, cc;
250 
251  if (c<=mx && c>=mn) {
252  fprintf(stderr,"PAINT: c = %d. Not be %d< c <%d\n\n",c,mn,mx);
253  return;
254  }
255 
256  cc = vp.gp[y*vp.xs+x];
257  if (cc>mx || cc<mn) return;
258 
259  while(x>0) {
260  if (vp.gp[y*vp.xs+x-1]>mx || vp.gp[y*vp.xs+x-1]<mn) break;
261  x--;
262  }
263  k = x;
264 
265  while(k<vp.xs) {
266  if (vp.gp[y*vp.xs+k]>mx || vp.gp[y*vp.xs+k]<mn) break;
267  vp.gp[y*vp.xs+k] = c;
268  k++;
269  }
270  k--;
271 
272  for (i=x; i<=k; i++){
273  if (y-1>=0 && y-1<vp.ys){
274  j = (y-1)*vp.xs+i;
275  if (vp.gp[j]<=mx && vp.gp[j]>=mn) {
276  paint(vp, i, y-1, mn, mx, c, m);
277  }
278 
279  if (Xabs(m)==8) { // 8-neighborhood *
280  if (i-1>=0) {
281  if (vp.gp[j-1]<=mx && vp.gp[j-1]>=mn) {
282  paint(vp, i-1, y-1, mn, mx, c, m);
283  }
284  }
285  if (i+1<vp.xs) {
286  if (vp.gp[j+1]<=mx && vp.gp[j+1]>=mn) {
287  paint(vp, i+1, y-1, mn, mx, c, m);
288  }
289  }
290  }
291  }
292 
293  if (y+1>=0 && y+1<vp.ys){
294  j = (y+1)*vp.xs+i;
295  if (vp.gp[j]<=mx && vp.gp[j]>=mn) {
296  paint(vp, i, y+1, mn, mx, c, m);
297  }
298 
299  if (Xabs(m)==8) { // 8-neighborhood
300  if (i-1>=0) {
301  if (vp.gp[j-1]<=mx && vp.gp[j-1]>=mn) {
302  paint(vp, i-1, y+1, mn, mx, c, m);
303  }
304  }
305  if (i+1<vp.xs) {
306  if (vp.gp[j+1]<=mx && vp.gp[j+1]>=mn) {
307  paint(vp, i+1, y+1, mn, mx, c, m);
308  }
309  }
310  }
311  }
312  }
313  return;
314 }
#define Xabs(x)
Definition: common.h:257

References WSGraph::gp, Xabs, WSGraph::xs, and WSGraph::ys.

Referenced by _paint_3d(), box(), and circle().

Here is the caller graph for this function:

◆ paint3d()

void paint3d ( WSGraph  vp,
int  x,
int  y,
int  z,
int  mn,
int  mx,
int  c,
int  m 
)

void paint3d(WSGraph vp, int x, int y, int z, int mn, int mx, int c, int m)

3Dグラフィックの塗りつぶし.
3Dグラフィック vpの点(x,y,z)から始めて, mn〜mx の輝度値を c で塗りつぶす.

Parameters
vpグラフィックデータ構造体.
x,y,z塗りつぶしを始める点の座標.
mn塗りつぶされる輝度値の最小値
mx塗りつぶされる輝度値の最大値.
c塗りつぶしの輝度値.
mモード.マイナスの場合は途中経過を表示.
+-8: 8近傍の塗りつぶし
その他: 4近傍の塗りつぶし

注:プログラム中で EGMAX を使用.

Definition at line 334 of file graph.c.

335 {
336  int i;
337 
338  _paint_3d(vp, x, y, z, mn, mx, SWORDMAX, m);
339  for (i=0; i<vp.xs*vp.ys*vp.zs; i++) {
340  if (vp.gp[i]==SWORDMAX) vp.gp[i] = c;
341  }
342 }
#define SWORDMAX
Definition: common.h:207

References _paint_3d(), WSGraph::gp, SWORDMAX, WSGraph::xs, WSGraph::ys, and WSGraph::zs.

Here is the call graph for this function:

◆ pool()

void pool ( WSGraph  gd,
vector  a,
vector  b,
int  rr,
int  cc 
)

void pool(WSGraph gd, vector a, vector b, int rr, int cc)

3D的な円柱の描画.中身はccで塗りつぶされる.

Parameters
gd操作対象となるグラフィックデータ構造体.
a円柱の一方の底面の円の中心の座標ベクトル.
b円柱のもう一方の底面の円の中心の座標ベクトル.
rr円柱の半径.
cc線と塗りつぶしの濃度.

Definition at line 924 of file graph.c.

925 {
926  int i, ll, cz;
927  vector ox, oz, ev;
928  WSGraph vp, px;
929 
930  ox = sub_vector(b, a);
931  ll = (int)(ox.n + 0.5);
932  vp = px = make_WSGraph(2*rr+3, 2*rr+3, ll);
933  if (vp.gp==NULL) return;
934 
935  for (i=0; i<vp.zs; i++) {
936  cz = i*vp.xs*vp.ys;
937  px.gp = &(vp.gp[cz]);
938  circle(px, rr+1, rr+1, rr, cc, ON);
939  }
940 
941  oz = set_vector((vp.xs-1)/2., (vp.ys-1)/2., 0.);
942  ev = unit_vector(ox);
943  local2world(gd, vp, a, oz, ev, NULL, NULL);
944  free(vp.gp);
945 
946  return;
947 }
#define sub_vector(a, b)
ベクトル a, bを引き算して, 結果を実数ベクトルで返す.
Definition: matrix.h:78
double n
ベクトルの大きさ
Definition: matrix.h:33

References circle(), WSGraph::gp, local2world(), make_WSGraph(), vector::n, ON, set_vector(), sub_vector, unit_vector(), WSGraph::xs, WSGraph::ys, and WSGraph::zs.

Here is the call graph for this function:

◆ set_around()

void set_around ( WSGraph  vp,
int  cc 
)

void set_around(WSGraph vp, int cc)

2Dグラフィックデータの縁の部分の輝度値を ccにする.

Parameters
vp操作対象となるグラフィックデータ構造体.
ccデータの縁に設定する輝度値.

Definition at line 1215 of file graph.c.

1216 {
1217  int i, px1, px2;
1218 
1219  for (i=0; i<vp.xs; i++){
1220  px1 = i;
1221  px2 = (vp.ys-1)*vp.xs + i;
1222  vp.gp[px1] = cc;
1223  vp.gp[px2] = cc;
1224  }
1225  for (i=1; i<vp.ys-1; i++){
1226  px1 = vp.xs*i;
1227  px2 = vp.xs*(i+1) - 1;
1228  vp.gp[px1] = cc;
1229  vp.gp[px2] = cc;
1230  }
1231 }

References WSGraph::gp, WSGraph::xs, and WSGraph::ys.

◆ set_bdat()

void set_bdat ( BSGraph  gd,
int  ix,
int  iy,
int  iz,
int  cc 
)

void set_bdat(BSGraph gd, int ix, int iy, int iz, int cc)

グラフィックデータ構造体 gdの任意の 1voxelに値を設定する.
座標の範囲チェックあり.Z軸の歪補整はなし.

Parameters
gd操作対象となるグラフィックデータ構造体.
ix,iy,iz値を設定する xyz座標.
cc点(ix,iy,iz)に設定する点の値(濃度).

Definition at line 166 of file graph.c.

167 {
168  if (ix>=0&&ix<gd.xs&&iy>=0&&iy<gd.ys&&iz>=0&&iz<gd.zs){
169  gd.gp[iz*gd.xs*gd.ys + iy*gd.xs + ix] = cc;
170  }
171 }

References BSGraph::gp, BSGraph::xs, BSGraph::ys, and BSGraph::zs.

Referenced by bline(), and bline3d().

Here is the caller graph for this function:

◆ set_idat()

void set_idat ( WSGraph  gd,
int  ix,
int  iy,
int  iz,
int  cc 
)

void set_idat(WSGraph gd, int ix, int iy, int iz, int cc)

グラフィックデータ構造体 gdの任意の 1voxelに値を設定する.@ 座標の範囲チェックあり.Z軸の歪補整はなし.

Parameters
gd操作対象となるグラフィックデータ構造体.
ix,iy,iz値を設定する xyz座標.
cc点(ix,iy,iz)に設定する点の値(濃度).

Definition at line 96 of file graph.c.

97 {
98  if (ix>=0&&ix<gd.xs&&iy>=0&&iy<gd.ys&&iz>=0&&iz<gd.zs){
99  gd.gp[iz*gd.xs*gd.ys + iy*gd.xs + ix] = cc;
100  }
101 }

References WSGraph::gp, WSGraph::xs, WSGraph::ys, and WSGraph::zs.

Referenced by circle(), line(), and line3d().

Here is the caller graph for this function:

◆ set_wdat()

void set_wdat ( WSGraph  gd,
double  xx,
double  yy,
double  zz,
int  cc,
IRBound  rb 
)

void set_wdat(WSGraph gd, double xx, double yy, double zz, int cc, IRBound rb)

グラフィックデータ構造体 gdの任意の 1voxelに値を設定する.
座標の範囲チェックあり.Z軸の歪補整あり(RZxy).

Parameters
gd操作対象となるグラフィックデータ構造体.
xx,yy,zz値を設定する xyz座標.
cc点(xx,yy,zz)に設定する点の値(濃度).
rb境界の底上げ値.rb.?min を基底値にする.
rb.miscが OFの場合,(xx,yy,zz)に一番近い点に ccを設定する.
rb.miscが ONの場合,(xx,yy,zz)の周りの 格子点全てに ccを設定する.

Definition at line 117 of file graph.c.

118 {
119  int i, j, k;
120  int x, y, z;
121  int ix, iy, iz;
122 
123  if (chk_RZxy()) zz = zz*RZxy; // (ex. *0.4/2.0)
124 
125  if (rb.misc==OFF) {
126  ix = (int)(xx+0.5) - rb.xmin;
127  iy = (int)(yy+0.5) - rb.ymin;
128  iz = (int)(zz+0.5) - rb.zmin;
129 
130  if (ix>=0&&ix<gd.xs&&iy>=0&&iy<gd.ys&&iz>=0&&iz<gd.zs){
131  gd.gp[iz*gd.xs*gd.ys + iy*gd.xs + ix] = cc;
132  }
133  }
134  else {
135  x = (int)(xx) - rb.xmin;
136  y = (int)(yy) - rb.ymin;
137  z = (int)(zz) - rb.zmin;
138 
139  for (i=0; i<=1; i++) {
140  for (j=0; j<=1; j++) {
141  for (k=0; k<=1; k++) {
142  ix = i + x;
143  iy = j + y;
144  iz = k + z;
145  if (ix>=0&&ix<gd.xs&&iy>=0&&iy<gd.ys&&iz>=0&&iz<gd.zs){
146  gd.gp[iz*gd.xs*gd.ys + iy*gd.xs + ix] = cc;
147  }
148  }
149  }
150  }
151  }
152  return;
153 }
#define OFF
Definition: common.h:231

References chk_RZxy(), WSGraph::gp, IRBound::misc, OFF, RZxy, IRBound::xmin, WSGraph::xs, IRBound::ymin, WSGraph::ys, IRBound::zmin, and WSGraph::zs.

Referenced by local2world(), and sphere().

Here is the call graph for this function:
Here is the caller graph for this function:

◆ sphere()

void sphere ( WSGraph  vp,
vector  a,
int  r,
int  cc,
int  mode 
)

void sphere(WSGraph vp, vector a, int r, int cc, int mode)

球の描画.

Parameters
vp操作対象となるグラフィックデータ構造体.
a球の中心の座標ベクトル.
r球の半径.
cc線と塗りつぶしの濃度(mode=1のとき)
modeモード.
1: 円を重ねて球を作る.中身はccで塗りつぶされる.
-1: 極座標で球を作る.vpとの境界に壁を作る.
それ以外: 極座標で球を作る.

Definition at line 1008 of file graph.c.

1009 {
1010  int i, j, k, rx, nn, s = 1;
1011  double th, fi, cs, sn, cf, sf, dt;
1012  double xx, yy, zz, zc;
1013  WSGraph xp;
1014  IRBound rb;
1015 
1016  memset(&xp, 0, sizeof(WSGraph));
1017 
1018  if (mode==1) {
1019  xp.xs = vp.xs;
1020  xp.ys = vp.ys;
1021  xp.zs = 1;
1022 
1023  for (k=(int)(a.z-r+0.5); k<=(int)(a.z+r+0.5); k++) {
1024  if (k>=0 && k<vp.zs) {
1025  xp.gp = &vp.gp[k*vp.xs*vp.ys];
1026  rx = (int)(sqrt(r*r-(a.z-k)*(a.z-k))+0.5);
1027  circle(xp, (int)a.x, (int)a.y, rx, cc, ON);
1028  }
1029  }
1030  }
1031  else {
1032  rb.xmin = rb.ymin = rb.zmin = 0;
1033  rb.misc = OFF;
1034 
1035  nn = (int)(2*PI*r + 0.5)*2;
1036  dt = PI/nn;
1037  for (i=0; i<=nn; i++) {
1038  th = dt*i;
1039  sn = sin(th);
1040  cs = cos(th);
1041  zz = r*cs + a.z;
1042  zc = zz*RZxy;
1043  if (mode==-1) {
1044  if (zc<s) zz = s/RZxy;
1045  if (zc>vp.zs-s-1) zz = (vp.zs-s-1)/RZxy;
1046  }
1047  for (j=0; j<=2*nn; j++) {
1048  fi = dt*j;
1049  cf = cos(fi);
1050  sf = sin(fi);
1051  xx = r*sn*cf + a.x;
1052  yy = r*sn*sf + a.y;
1053  if (mode==-1) {
1054  if (xx<s) xx = (double)s;
1055  if (yy<s) yy = (double)s;
1056  if (xx>vp.xs-s-1) xx = (double)(vp.xs-s-1);
1057  if (yy>vp.ys-s-1) yy = (double)(vp.ys-s-1);
1058  }
1059  set_wdat(vp, xx, yy, zz, cc, rb);
1060  }
1061  }
1062  }
1063  return;
1064 }
#define PI
Definition: common.h:182

References circle(), WSGraph::gp, IRBound::misc, OFF, ON, PI, RZxy, set_wdat(), vector::x, IRBound::xmin, WSGraph::xs, vector::y, IRBound::ymin, WSGraph::ys, vector::z, IRBound::zmin, and WSGraph::zs.

Here is the call graph for this function:

◆ topola()

void topola ( vector  nv,
double *  cst,
double *  snt,
double *  csf,
double *  snf 
)

void topola(vector nv, double* cst, double* snt, double* csf, double* snf)

ベクトル nvの単位ベクトルを極座標 (1,θ,φ) へ変換する. ただし,θφは sin, cosの値として返される.

Parameters
nv方向ベクトル.
[out]cst指定しない.cosθの値が入る.
[out]snt指定しない.sinθの値が入る.
[in,out]csf通常は cosφの値が入る. sinθが0に近い場合は計算しないので,連続計算の場合は予め直前の cosφの値を入れて置く.
[in,out]snf通常は sinφの値が入る. sinθが0に近い場合は計算しないので,連続計算の場合は予め直前の sinφの値を入れて置く.

Definition at line 1111 of file graph.c.

1112 {
1113  if (nv.n>EPS && nv.n!=1.0) {
1114  nv.x = nv.x/nv.n;
1115  nv.y = nv.y/nv.n;
1116  nv.z = nv.z/nv.n;
1117  }
1118 
1119  if (nv.z<-1.0) nv.z = -1.0;
1120  if (nv.z> 1.0) nv.z = 1.0;
1121  *cst = nv.z;
1122  *snt = sqrt(1.0-nv.z*nv.z);
1123 
1124  if (*snt<EPS) {
1125  *cst = Sign(*cst);
1126  *snt = 0.0;
1127  //*csf = 0.0;
1128  //*snf = 1.0;
1129  }
1130  else {
1131  *csf = nv.x / *snt;
1132  *snf = nv.y / *snt;
1133  }
1134  return;
1135 }
#define Sign(x)
Definition: common.h:253
double EPS
Definition: mt.c:9

References EPS, vector::n, Sign, vector::x, vector::y, and vector::z.

Referenced by local2world().

Here is the caller graph for this function:

◆ torus()

void torus ( WSGraph  gd,
vector  ox,
vector  ex,
int  rr,
int  ra,
int  cc 
)

void torus(WSGraph gd, vector ox, vector ex, int rr, int ra, int cc)

3D的なトーラスの描画.中身はccで塗りつぶされる.

Parameters
gd操作対象となるグラフィックデータ構造体.
oxトーラスの中心の座標ベクトル.
exトーラスの中心の法線ベクトル.
rrトーラスの半径(トーラスの中心から断面の円の中心まで).
raトーラスの断面の円の半径
cc線と塗りつぶしの濃度.

Definition at line 962 of file graph.c.

963 {
964  int i, nn;
965  double dt, th, xx, yy, zz, sn, cs;
966  WSGraph vp;
967  vector ve, vo, vz;
968 
969  vp = make_WSGraph(2*(rr+ra)+3, 2*(rr+ra)+3, 2*ra+3);
970  if (vp.gp==NULL) return;
971  nn = (int)(2*PI*(rr+ra)*2);
972  dt = 2.0*PI/nn;
973 
974  zz = (vp.zs-1)/2.;
975  for (i=0; i<nn; i++) {
976  th = dt*i;
977  sn = sin(th);
978  cs = cos(th);
979  xx = (vp.xs-1)/2. + rr*cs;
980  yy = (vp.ys-1)/2. - rr*sn;
981  vo = set_vector(xx, yy, zz);
982  ve = set_vector(sn, cs, 0.0);
983  circle3d(vp, vo, ve, ra, cc, ON);
984  }
985  vz = set_vector((vp.xs-1)/2., (vp.ys-1)/2., (vp.zs-1)/2.);
986  ex = unit_vector(ex);
987 
988  local2world(gd, vp, ox, vz, ex, NULL, NULL);
989  free(vp.gp);
990  return;
991 }
void circle3d(WSGraph gd, vector ox, vector ex, int rr, int cc, int mode)
Definition: graph.c:896

References circle3d(), WSGraph::gp, local2world(), make_WSGraph(), ON, PI, set_vector(), unit_vector(), WSGraph::xs, WSGraph::ys, and WSGraph::zs.

Here is the call graph for this function:

◆ triangle()

void triangle ( WSGraph  vp,
int  x1,
int  y1,
int  x2,
int  y2,
int  x3,
int  y3,
int  cc,
int  mode 
)

void triangle(WSGraph vp, int x1, int y1, int x2, int y2, int x3, int y3, int cc, int mode)

2Dの三角形の描画.
点(x1,y1),(x2,y2),(x3,y3)の三点を頂点とした三角形を描く.
線の濃度は cc. modeが 1以上なら,三角形の内部を塗りつぶす.

Parameters
vp操作対象となるグラフィックデータ構造体.
(x1,y1),(x2,y2),(x3,y3)三角形の頂点の座標.
cc線の濃度.
modeON なら三角形の内部の0〜ccをccで塗りつぶす.
使用例
// (100,100),(100,200),(200,100)を頂点とした三角形(直角三角形)を描き,内部を塗りつぶす
triangle(vp, 100, 100, 100, 200, 200, 100, 1000, ON);
void triangle(WSGraph vp, int x1, int y1, int x2, int y2, int x3, int y3, int cc, int mode)
Definition: graph.c:522

Definition at line 522 of file graph.c.

523 {
524  line(vp, x1, y1, x2, y2, cc);
525  line(vp, x2, y2, x3, y3, cc);
526  line(vp, x3, y3, x1, y1, cc);
527 
528  if (mode==ON) {
529  int i, j, minx, miny, maxx, maxy;
530  minx = maxx = x1;
531  miny = maxy = y1;
532  minx = Min(x2, minx);
533  minx = Min(x3, minx);
534  miny = Min(y2, miny);
535  miny = Min(y3, miny);
536  maxx = Max(x2, maxx);
537  maxx = Max(x3, maxx);
538  maxy = Max(y2, maxy);
539  maxy = Max(y3, maxy);
540 
541  for (j=miny; j<=maxy; j++) {
542  for (i=minx; i<=maxx; i++) {
543  if (isinctri(x1, y1, x2, y2, x3, y3, i, j)) Px(vp, i, j) = cc;
544  }
545  }
546  }
547  return;
548 }
int isinctri(int x1, int y1, int x2, int y2, int x3, int y3, int xx, int yy)
Definition: graph.c:559

References isinctri(), line(), Max, Min, ON, and Px.

Here is the call graph for this function:

◆ x_reverse_wsg()

WSGraph x_reverse_wsg ( WSGraph  vp)

WSGraph x_reverse_wsg(WSGraph vp)

グラフィックデータの x軸を反転させる.

Parameters
vp操作対象となるグラフィックデータ構造体.
Returns
反転したグラフィックデータ.

Definition at line 1075 of file graph.c.

1076 {
1077  int i, j, cy;
1078  WSGraph wp;
1079 
1080  wp = make_WSGraph(vp.xs, vp.ys, 1);
1081  if (wp.gp==NULL) {
1082  memset(&wp, 0, sizeof(WSGraph));
1084  return wp;
1085  }
1086 
1087  for (j=0; j<vp.ys; j++) {
1088  cy = j*vp.xs;
1089  for (i=0; i<vp.xs; i++) {
1090  wp.gp[cy +i] = vp.gp[cy + vp.xs - 1 - i];
1091  }
1092  }
1093  return wp;
1094 }

References WSGraph::gp, JBXL_GRAPH_MEMORY_ERROR, make_WSGraph(), WSGraph::state, WSGraph::xs, and WSGraph::ys.

Here is the call graph for this function:

◆ zoom_WSGraph()

WSGraph zoom_WSGraph ( WSGraph  vp,
int  zm,
int  mode 
)

WSGraph zoom_WSGraph(WSGraph vp, int zm, int mode)

グラフィックデータ拡大する.

Parameters
vp変換する Word型単純グラフィックデータ.
zm倍率.
modeモード.1: 線形補間拡大,その他: 単純拡大
Returns
拡大したグラフィックデータ.

Definition at line 1245 of file graph.c.

1246 {
1247  WSGraph vx;
1248  int i, j, k, l, m, n;
1249  sWord ws, wt;
1250 
1251  memset(&vx, 0, sizeof(WSGraph));
1252  if (zm<1) {
1254  return vx;
1255  }
1256 
1257  vx = make_WSGraph(vp.xs*zm, vp.ys*zm, 1);
1258  if (vx.gp==NULL) {
1259  memset(&vx, 0, sizeof(WSGraph));
1261  return vx;
1262  }
1263 
1264  if (mode==1){
1265  for(j=0; j<vp.ys; j++) {
1266  for(i=0; i<vp.xs; i++) {
1267  m = i + j*vp.xs;
1268  n = (i + j*vx.xs)*zm;
1269  if(i==vp.xs-1) wt = 0;
1270  else wt = (vp.gp[m+1] - vp.gp[m])/zm;
1271  if(j==vp.ys-1) ws = 0;
1272  else ws = (vp.gp[m+vp.xs] - vp.gp[m])/zm;
1273 
1274  for(k=0; k<zm; k++) {
1275  for(l=0; l<zm; l++) {
1276  vx.gp[n+l+k*vx.xs] = ws*k + wt*l + vp.gp[m];
1277  }
1278  }
1279  }
1280  }
1281  }
1282  else {
1283  for(j=0; j<vp.ys; j++) {
1284  for(i=0; i<vp.xs; i++) {
1285  m = i + j*vp.xs;
1286  n = (i + j*vx.xs)*zm;
1287  for(k=0; k<zm; k++) {
1288  for(l=0; l<zm; l++) {
1289  vx.gp[n+l+k*vx.xs] = vp.gp[m];
1290  }
1291  }
1292  }
1293  }
1294  }
1295  return vx;
1296 }
short sWord
2Byte
Definition: common.h:335
#define JBXL_GRAPH_IVDARG_ERROR
無効な引数
Definition: jbxl_state.h:178

References WSGraph::gp, JBXL_GRAPH_IVDARG_ERROR, JBXL_GRAPH_MEMORY_ERROR, make_WSGraph(), WSGraph::state, WSGraph::xs, and WSGraph::ys.

Here is the call graph for this function: